
Cloud Health Checks: Best Practices
Cloud health checks ensure your applications run smoothly by monitoring performance, availability, and reliability. They go beyond your cloud provider's uptime guarantees, focusing on issues like misconfigured load balancers or database limits that could disrupt your app. Here's the core takeaway:
- Why it matters: Your cloud provider's infrastructure might be fine, but your application could still fail. Health checks help detect and fix these issues early.
- What to monitor: Critical resources (e.g., databases, authentication services) and metrics like response time, error rates, CPU, and memory usage.
- How to set up: Use protocols like HTTP, TCP, or gRPC and configure probes for liveness, readiness, and startup checks.
- Key metrics: Aim for sub-second response times, error rates below 1%, and balanced CPU (30%-70%) and memory (20%-80%) usage.
- Automation: Integrate health checks into CI/CD pipelines and use tools for anomaly detection and log analysis.
The goal? To catch issues before they impact users and maintain application reliability. Regular updates and feedback loops keep your checks effective as systems evolve.
Health checks with Terraform Cloud continuous validation
Planning and Setting Up Health Checks
Before diving into monitoring tools, it’s essential to map out the key components of your system. Start by identifying the elements that are crucial to your application’s core functionality and set clear benchmarks to measure their health.
Identifying Critical Resources
To avoid blind spots, monitor all layers - application, platform, infrastructure, and network.
Not every dependency requires the same level of attention. Focus on critical ones, such as your primary database or authentication service, because their failure directly impacts core functionality. In contrast, non-critical dependencies - like analytics engines or recommendation tools - can experience issues without shutting down your entire application. Misprioritizing these can lead to unnecessary alerts and distractions.
The key is to prioritize based on business impact. For example, a payment processing failure has an immediate effect on revenue, while a delayed reporting dashboard, though inconvenient, is less urgent. Map out user flows to see which infrastructure components support critical business scenarios. This mapping reveals how systems are interconnected and highlights areas where a failure could cascade.
Be mindful of gray failures - cases where a system technically responds but performs so poorly that it degrades the user experience. Additionally, watch for cloud-specific risks like configuration drift in security groups, expiring SSL certificates, or unexpected changes to DNS records, as these are common causes of outages.
This detailed analysis not only ensures smoother operations but also strengthens production readiness and user satisfaction. Once you’ve identified the critical resources, the next step is to define what constitutes acceptable performance.
Defining Performance Baselines and Thresholds
After pinpointing essential components, establish measurable benchmarks to monitor their health. Use historical data to define what "normal" looks like during both peak and off-peak periods. These baselines help you spot issues early - before they escalate.
Set specific targets for different types of health checks. For example:
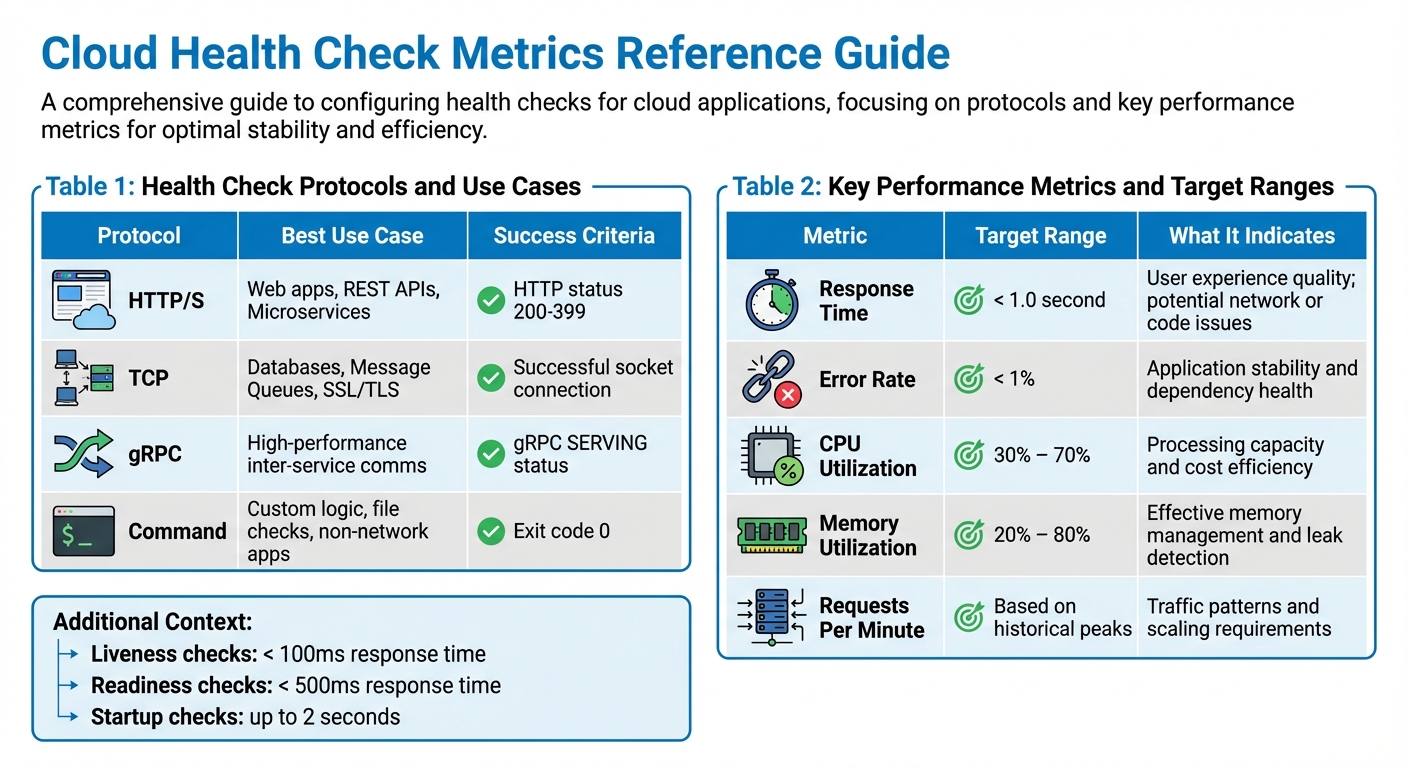
- Liveness checks (is the process running?) should respond in under 100ms.
- Readiness checks (is it ready to handle traffic?) should complete within 500ms.
- Startup checks (has initialization finished?) can take up to 2 seconds.
For error rates, aim to keep them below 1% in production. CPU utilization should typically range between 30% and 70%, while memory usage should stay between 20% and 80%, leaving room for unexpected spikes. In Kubernetes environments, aim to keep your API server’s p99 response latency under 1 second for non-LIST requests, and ensure your etcd database size stays below 8GB.
To avoid false alarms from transient issues, set thresholds that require 2 to 3 consecutive failures before marking a resource as unhealthy. Similarly, introduce an initial delay - around 300 seconds - for new instances to finish startup routines before health checks begin. This prevents premature alerts.
Finally, define three health states:
- Healthy: Operating at optimal performance.
- Degraded: Showing warning signs or throttling.
- Unhealthy: Experiencing critical failure or non-responsiveness.
This tiered system allows for proportional responses. For example, a degraded state might warrant investigation during regular business hours, while an unhealthy state demands immediate action.
Configuring Health Checks
Once you've identified your critical resources and established performance baselines, the next step is setting up health checks. The way you configure these checks depends on your application’s architecture, the protocols it uses, and how quickly you need to detect and respond to failures.
Selecting Protocols and Check Types
Your choice of protocol for health checks should align with what your application supports. For web servers, REST APIs, and microservices, HTTP/HTTPS is often the best option. A successful check typically returns an HTTP status code between 200 and 399. For databases like PostgreSQL or Redis, TCP checks are a good fit - they confirm that the port is accepting connections. If you're working with gRPC-based microservices, gRPC health checks are ideal. They use a binary protocol and return a SERVING status when the service is healthy.
It's also important to choose the right probe type for your needs:
- Startup probes: Verify that your application has completed initialization. These are useful for applications that load large datasets or warm caches during startup.
- Readiness probes: Determine if an instance is ready to handle traffic. If a readiness probe fails, the load balancer removes the instance without restarting it.
- Liveness probes: Detect when an application is in an unrecoverable state, like a deadlock, and trigger a restart. Keep these probes simple to avoid unnecessary restarts caused by external dependencies.
Here’s a quick breakdown of protocols and their use cases:
| Protocol | Best Use Case | Success Criteria |
|---|---|---|
| HTTP/S | Web apps, REST APIs, Microservices | HTTP status 200-399 |
| TCP | Databases, Message Queues, SSL/TLS | Successful socket connection |
| gRPC | High-performance inter-service comms | gRPC SERVING status |
| Command | Custom logic, file checks, non-network apps | Exit code 0 |
Once you’ve chosen your protocols and probes, the next step is fine-tuning their timing parameters to ensure effective monitoring.
Setting Check Intervals and Timeouts
Timing settings play a crucial role in balancing detection speed and system stability. These include:
- Check interval: How often the probes run.
- Timeout: How long the probe waits for a response.
- Failure threshold: The number of consecutive failures that trigger a state change.
For applications sensitive to latency, use shorter intervals (e.g., a 5-second interval, 3-second timeout, and failure threshold of 2). For more stable systems, longer intervals (e.g., a 30-second interval, 10-second timeout, and failure threshold of 5) can help avoid unnecessary state changes.
Slow-starting applications need special attention. Use the initialDelaySeconds parameter to account for startup times, preventing premature liveness probe failures. For example, if your application takes up to 10 minutes to initialize, configure a startup probe with a 24-second interval, a 1-second timeout, and a failure threshold of 25.
Configuring Multi-Region and Multi-Probe Checks
To get a complete picture of your application's health, expand your checks to include multiple geographic regions. Probing from different locations helps distinguish between localized network issues and actual service outages.
"Multi-region checking differentiates between local network issues and true service unavailability." - Upstat
Make sure your firewall rules allow traffic from all necessary IP ranges. For instance, Google Cloud health checks originate from 130.211.0.0/22 and 35.191.0.0/16. Blocking these ranges will prevent probes from reaching your instances.
Additionally, set a success threshold (e.g., 2 or 3 consecutive successful checks) before marking an instance as healthy again. This avoids rapid state changes that can destabilize your system.
For a distributed setup, consider this example: If you run health checks every minute from six locations over 25 minutes, you’ll generate 150 requests. To calculate uptime, use the formula: (S/T)*100, where S is the number of successful responses and T is the total requests. If your dashboard shows 83.3% uptime, that means 125 out of 150 checks were successful.
Key Metrics to Monitor
Cloud Health Check Protocols and Target Performance Metrics
Once health checks are in place, it’s crucial to focus on tracking the most important metrics. Keeping an eye on the right data points helps you spot problems early and make informed decisions about scaling and performance.
Response Time and Error Rates
Response time measures how quickly your application processes a user request. Ideally, you should aim for sub-second response times. A sudden increase in response time might point to issues like network delays, inefficient code, or resource bottlenecks. By comparing response time with your requests per minute (RPM), you can figure out whether slowdowns are caused by traffic surges or deeper issues.
Error rates track the percentage of failed requests, which could stem from HTTP 5xx errors, database issues, or application crashes. Keeping error rates within acceptable limits is key to maintaining a smooth user experience. High error rates might indicate bugs, infrastructure problems, or failing dependencies. As the AWS Well-Architected Framework explains:
"A metric related to business outcomes such as the number of orders successfully processed per minute, can indicate workload issues faster than technical metric, such as CPU Utilization."
To manage alerts effectively, set up tiered notifications. For example:
- Tier 1 alerts (via SMS or phone): For critical outages.
- Tier 2 alerts (via Slack or email): For ongoing performance issues.
- Tier 3 alerts: For general trends or informational updates.
In addition to response and error rates, monitoring resource usage provides a clear picture of system health.
Resource Utilization Metrics
CPU utilization shows how much processing power your system is using. A range of 30% to 70% is often ideal, leaving room for traffic spikes while avoiding wasted resources. Values outside this range usually signal performance or provisioning problems.
Memory utilization should generally stay between 20% and 80%. If both CPU and memory usage increase together, it might indicate a memory leak that needs immediate attention. For accurate tracking:
- On Linux and macOS, monitor
mem_used_percent. - On Windows, track
Memory % Committed Bytes In Use.
These metrics are critical for managing system performance and keeping costs under control.
Custom Application Metrics
Beyond technical metrics, it’s essential to track metrics tied to your application's business goals. While CPU and memory usage highlight infrastructure health, custom application metrics show how well your app is meeting user needs. Examples include:
- Transaction rates
- Queue depths
- Database connection pool usage
- Successful orders per minute
For business-critical processes like payment systems, monitoring transactions per minute can help identify problems before technical alerts kick in. Similarly, for background jobs, you can use heartbeat monitoring. Configure tasks to send a signal upon completion, and if the signal isn’t received in time, trigger an alert.
Combining multiple metrics provides a more complete view of system health. For instance, correlating server latency with 5xx error rates can reveal hidden issues. Publishing these custom metrics to your cloud monitoring tools ensures proactive responses while keeping checks lightweight and effective.
| Metric | Target Range | What It Indicates |
|---|---|---|
| Response Time | < 1.0 second | User experience quality; potential network or code issues |
| Error Rate | < 1% | Application stability and dependency health |
| CPU Utilization | 30% – 70% | Processing capacity and cost efficiency |
| Memory Utilization | 20% – 80% | Effective memory management and leak detection |
| Requests Per Minute | Based on historical peaks | Traffic patterns and scaling requirements |
sbb-itb-3b7b063
Automation and Advanced Validation
Relying solely on manual checks just doesn't cut it when you're dealing with large-scale systems. By incorporating automated validation into your deployment workflows, you can catch issues that traditional monitoring might overlook.
Automating Health Checks in CI/CD Pipelines
One of the best ways to prevent bad releases is to validate system health immediately after deployment. A great method for this is the Deployment Monitoring Pattern: deploy your system, run external checks within the first minute, and automatically trigger rollbacks if something fails. This is especially effective for catching issues like misconfigured security groups that block traffic or DNS records overwritten by Infrastructure-as-Code.
For background jobs or scheduled tasks, consider using heartbeat monitoring. Set up a system where tasks ping a specific URL upon completion. If the signal doesn’t arrive within the expected timeframe, an automated alert is triggered.
If you're managing instance groups or auto-scaling fleets, take advantage of autohealing features. For instance, Google Cloud's Managed Instance Groups can automatically recreate virtual machines (VMs) that fail health checks. To avoid unnecessary cycles of VM recreation, set an initial delay - around 300 seconds - to give startup scripts enough time to complete. Also, make autohealing checks more forgiving than load balancing checks by setting higher failure thresholds. This reduces the risk of prematurely removing VMs that are just slow to respond.
Anomaly Detection and Log Analysis
Basic uptime checks are a good start, but they won't catch everything. Automated log analysis can help uncover unusual patterns that point to deeper issues. For example, periodic drift detection compares your actual cloud environment with your Terraform configurations. This helps identify manual changes or unauthorized modifications that could lead to security or compliance problems.
AI-powered diagnostics take things a step further by interpreting complex issues like CrashLoopBackOff errors or out-of-memory problems. These tools analyze cluster logs and metrics to pinpoint root causes, eliminating the need for manual log parsing and cutting down the time it takes to resolve issues.
"Cloud infrastructure monitoring means watching your services from the outside, the same way your users experience them, regardless of what your provider's status page says."
With these advanced techniques, automated tools can provide even deeper insights into system health and performance.
Using Kanu AI for Automated Validation

Kanu AI's QA Agent brings automated validation to the next level. It performs over 250 checks on live systems, analyzing logs, metrics, and offering actionable diagnostics. After every deployment, the QA Agent evaluates system behavior, flags configuration issues, and even suggests specific code fixes to address problems. This ensures your applications are production-ready before they face real-world traffic, minimizing deployment risks and speeding up the journey from development to production.
Improving Health Checks Over Time
When it comes to health checks, setting them up once and leaving them untouched is a recipe for trouble. As cloud applications grow and change, they naturally deviate from their original configurations. Temporary fixes often become permanent, permissions loosen, and settings drift. Without regular updates, these issues can snowball into outages. To keep your health checks effective, you need a strategy of continuous improvement that evolves alongside your infrastructure and compliance requirements.
Reviewing and Updating Configurations
Keeping your health checks in sync with your infrastructure requires a structured review process. Here's a practical approach:
- Weekly: Run automated scans to catch vulnerabilities and check basic configurations.
- Monthly: Audit RBAC permissions, review resource usage, and verify certificate expiration dates.
- Quarterly: Perform deep dives like CIS benchmark evaluations, disaster recovery tests, and network policy reviews.
Managing health checks as code using tools like Terraform ensures they evolve with your infrastructure. Version control helps you track changes and align configurations with updates. For instance, when tweaking settings like initialDelaySeconds or timeoutSeconds, rely on data from peak load performance instead of sticking to outdated defaults.
This tiered approach ensures that your health checks remain relevant and effective, while also providing a foundation for continuous improvement.
Creating Feedback Loops
Feedback loops are essential for refining health checks. Post-incident reviews, when conducted promptly (ideally within a week), can lead to a 50% improvement in implementing corrective measures. A blameless post-mortem approach focuses on technical gaps, such as missed health signals or overly lenient thresholds, rather than assigning fault.
Take Ancestry.com as an example. In March 2026, they integrated observability with their delivery pipeline using Harness AI-Powered Verification and Rollback. This move cut production outages by 50% and boosted uptime to 99.9%. By tying deployment validation directly to health check improvements, they created a feedback loop that continually enhanced system reliability.
Chaos engineering offers another powerful tool for feedback. Simulating failures in controlled environments helps test whether your health checks can detect issues as expected. If a simulated database failure goes unnoticed, it's a clear sign that your checks need adjustment.
Maintaining Compliance and Audit Trails
Strong documentation and audit trails are crucial for meeting compliance requirements like SOC 2, HIPAA, and PCI-DSS. Enable API server audit logging and store those logs in a durable backend. This not only supports regulatory reviews but also aids in post-incident forensics.
Running the CIS Kubernetes Benchmark is a must for production clusters, ensuring your health checks meet security standards. While you can limit detailed health data retention to 30 days to save costs, retain key data for regulatory audits or long-term analysis.
| Audit Frequency | Recommended Activities |
|---|---|
| Weekly | Automated configuration scans, image vulnerability scanning |
| Monthly | RBAC audit, resource utilization review, certificate expiry check |
| Quarterly | Full CIS benchmark run, disaster recovery test, network policy review |
Organizations that analyze incident data over time report a 30% drop in repeat issues. This cycle of audits and feedback strengthens the reliability of health checks as your systems grow and change.
Conclusion
Keeping cloud systems in check requires a constant, multi-layered approach to validation. This means performing checks at both the node and cluster levels, using calculated metrics and diagnostic endpoints, and monitoring proactively to avoid failures that can snowball into larger issues.
"A health check isn't a one-time event. The clusters that stay healthy are the ones where these checks are automated and run continuously." - k8s.sa
Automation plays a critical role here. Integrating validation into CI/CD pipelines ensures that only stable builds make it to production. At the same time, continuous monitoring helps catch hidden failures - those situations where everything might seem fine on the surface but critical components are actually failing. With cloud-native platforms expected to underpin 95% of new digital initiatives by 2025, automated health checks have gone from being a nice-to-have to a must-have.
Take Kanu AI, for example. It simplifies cloud management with over 250 real-time validation checks, actionable insights derived from logs and metrics, and comprehensive reports that minimize the need for manual troubleshooting. This AI-powered solution is designed to tackle the increasing complexity of modern cloud environments while ensuring enterprises maintain the control and security they need. Regular refinement of these processes keeps systems resilient and ready for production.
The strongest systems view health checks as evolving documentation - constantly updated and improved based on the lessons learned from past incidents. This dynamic approach is key to staying ahead in the ever-changing world of cloud computing.
FAQs
What should my health check endpoint actually verify?
A health check endpoint plays a vital role in ensuring your application runs smoothly. It should verify several key aspects:
- Application Responsiveness: Confirm that the app is active and responding to requests.
- Dependency Health: Check the status of critical dependencies like databases, APIs, or external services.
- Resource Availability: Ensure there are sufficient resources (e.g., memory, CPU, disk space) for the application to function properly.
- System State: Assess the overall condition of the system to detect any underlying issues.
By monitoring these factors, a health check endpoint helps identify problems early, making troubleshooting faster and more effective.
How do I set health check timeouts and thresholds without flapping?
When configuring health check probes, it's important to strike the right balance between sensitivity and stability to avoid flapping. To minimize false negatives, consider using a longer timeoutSeconds value. Additionally, set failureThreshold and successThreshold to require multiple consecutive failures or successes before changing the health status. This approach ensures more reliable results.
For intervalSeconds, choose a frequency that’s sufficient to catch issues promptly but not so frequent that it creates unnecessary load or causes the system to constantly switch between healthy and unhealthy states.
How can I automate health checks to stop bad deploys in CI/CD?
Automating health checks in your CI/CD pipeline is a smart way to avoid problematic deployments. Set up post-deployment verification steps, such as Kubernetes readiness and liveness probes or custom tests, to monitor the health of your deployment. These checks can quickly identify issues like unresponsive endpoints or poor performance metrics.
If a failure is detected, implement automated rollbacks to immediately revert to the last stable version. This approach ensures that only stable deployments move forward, reducing downtime and keeping production environments running smoothly.